May 20, 2003 - By Kevin Stanley, OCI Partner and Principal Software Engineer
Middleware News Brief (MNB) features news and technical information about Open Source middleware technologies.
INTRODUCTION
Object Viewing Analysis Tool for Integrated Object Networks (OVATION) is a freely available, open-source tool set developed to assist in the debugging, diagnosis, and analysis of distributed applications. OVATION permits the collection of information about interactions between application components and facilitates the presentation of this data in a graphical tool.
Specifically, the OVATION collector tool accumulates remote method invocations and event channel events between distributed objects, threads, and processes independent of their location in a distributed system. The collected data can be examined through a GUI visualizer, or the data can be exported to a text file and examined by third-party or user-specific tools.
The motivation for the development of OVATION was to fill the present gap that exists between tools for debugging and analyzing distributed applications. Distributed object systems often consist of elaborate networks connecting diverse architectures and environments. Debugging such applications can be time-consuming and error-prone because they involve several processes communicating across networks, making it difficult to track the end-to-end interactions.
Existing debugging tools are useful once a problem has been narrowed to a single process; however isolating it to a single process can be extremely difficult due to non-deterministic behavior and complex timing involved in distributed and real-time applications. The evolution of such systems has been hindered due to the absence of available tools that permit the debugging, diagnosis, and analysis of such complex environments. In order to support the stringent and diverse requirements of the distributed object environments, more sophisticated, powerful tools are clearly necessary. OVATION was designed and developed to meet these requirements.
Any tool used for analysis of distributed environments should be scalable and consistent across a multitude of platforms. Such a tool should do all of the following:
- Permit the developer to analyze distributed applications
- Capture high-level architectural views
- Determine the order of interactions between objects across process and thread boundaries
- Identify interrelationships between distributed components (processes, threads, and objects)
- Track control flow of messages between objects unobtrusively
- Identify opportunities for optimizing performance via load balancing
Other design goals of OVATION include:
Figure 1: Overview of OVATION Architecture
Figure 1 shows a high-level architecture of OVATION.
- The Probe Framework is responsible for invoking the installed probes and also permits the straightforward inclusion of new and user-defined probes.
- The Application being instrumented begins by loading in the required Probe Framework and associated Probes (in this illustration these are the Snooper, Thread, RTEC probe, and a "user-defined" Probe).
- The Portable Interceptor Servant acts as the external interface that sends triggering events to the Probe Framework to request data collection.
- The Probe Framework then forwards these requests to all instantiated Probes.
- The data that the Probes collect is made then available to the Probe Framework via the Framework-Probe Interface.
- Finally, the Probe Framework sends the data to the OVATION Collector process.
We will now review in greater details OVATION's Collection and Visualization components.
DATA COLLECTION IN OVATION
The core function of OVATION is to collect data about the applications and systems that are being instrumented and present it in a coherent fashion.
An extensible probe framework performs the collection of data. OVATION's Probe Framework is highly configurable and results in minimal intrusion into the system being instrumented. OVATION provides a set of probes that are intended to gather data, including information about CORBA requests, milestones that have been reached, data with regard to suppliers and consumers, events sent between them, and much more.
The following subsections describe the Probe Framework and a set of probes supplied with OVATION.
PROBE FRAMEWORK
Successful development, deployment, and maintenance of any distributed system requires the ability of developers, integrators, and administrators to monitor and/or control the health of not only the application, but the middleware on which the application is built. However, middleware vendors are unlikely to anticipate the myriad use cases for their software, let alone the monitoring and debugging needs of their clients. Thus, the ideal tool for monitoring and instrumenting distributed applications is adaptable and field-configurable.
Often more important than simply gathering data ("monitoring") is correlating data from distinct system events. As events occur over a period of time, such events may be stratified through different layers within the system as well. The overriding notion is that a single event does not typically reveal much information, but that same event when placed in the context of other events, reveals much about the state of the system.
The OVATION Probe Framework provides an architecture that offers the opportunity to perform such open-ended monitoring. At its heart, the Framework is simply a toolkit for triggering collection of data from dynamically-loaded probes on a user-definable system event (such as a CORBA Invocation) and correlating the collected data within a trigger and across time.
Some key concepts in the Framework include:
- System. This consists of an application, middleware, operating system, hardware, etc.
- System Event. A System Event is simply a point of execution within the system; it may occur at any level within the System.
- Trigger. This is the means by which the Framework is notified of the occurrence of a SYSTEM EVENT. The external result of a TRIGGER is the collection of a PROBE RECORD.
- Probe. A small, dynamically-loaded bit of code which, at the occurrence of a SYSTEM EVENT, must decide whether it will provide data or not.
- Probe Record. The aggregate of all data provided by all registered PROBEs for a specific TRIGGER.
OVATION's Probe Framework is extensible, as it permits novel, customized probes to be added to OVATION with relative ease. The Probe Framework also permits users to dynamically select the probes to be utilized for a particular application, thereby minimizing the need to change application code.
To use OVATION in an application, one must first load the Probe Framework along with the desired set of probes. The Probe Framework is then responsible for triggering a set of probes and forwarding their data to the OVATION Collector.
Each of the probes provided as part of OVATION are described in the following sections.
SNOOPER PROBE
The Snooper Probe is essentially a CORBA Invocation Probe. Its purpose is to instrument the client and server requests and responses to capture the end-to-end CORBA invocation path.
The probe gathers information such as the name of the request, arguments to the request, the time when the request started, and the time when the response is received. It also collects information about the process and thread to which the request or response belongs. This probe relies on CORBA Portable Interceptors to trigger the gathering of the information.
MILESTONE PROBE
The OVATION Milestone probe permits the manual demarcation of specific events in the application code. For example, the user may wish to know the temporal relationship of events in relation to when an application mode change is made. The Milestone probe is ideal for this scenario.
Two types of milestones are supported: conditional and unconditional. A conditional milestone is one in which a particular condition must be met in order to trigger the milestone. An example of a conditional milestone is one that is generated if the server has successfully responded to 3,000 requests.
TRACE PROBE
While the Snooper Probe works only in the case of CORBA calls, the OVATION Trace Probe can be used to capture information about other non-CORBA C++ object method invocations. The Trace Probe gathers the operation name, the component to which the operation belongs, the arguments of the operation, and any other data that the user wants to be tracked. This can be useful to help provide context to the application's distributed object invocations.
RTEC PROBE
The RTEC Probe is a specialized probe that captures the distributed object invocations at a higher level, namely the CORBA Service level. It captures events flowing through the system in applications that use the TAO Real-Time Event Channel (RTEC). The RTEC Probe helps gather information regarding suppliers, consumers, and the events sent between them. This probe, like the Snooper Probe, also relies on Portable Interceptors to trigger the gathering of the information.
LOG WRITER PROBE
Collected probe data must eventually be sent to the OVATION Collector process. Probe data can be flushed manually through a set of macros provided in OVATION; however, this method requires source code modifications, and for applications that run for a prolonged period of time, finding strategic locations to place macro calls may be difficult.
The Log Writer probe was created to provide an alternate mechanism for triggering the transmission of the probe data to the collector. This probe has the responsibility of responding to triggers from the Probe Framework and determining when to log the data. By default, the Log Writer probe writes the log data every tenth time the probe is triggered.
COLLECTOR PROCESS
The Collector is responsible for writing the probe data to a file so that it may be loaded for off-line viewing by the Visualizer. The log file is written using XML so that it may also be easily utilized by other analysis tools offline.
OVATION uses a separate process to collect data from probes in a distributed application and write it to a log file. This log file can be loaded in the OVATION Visualizer so that the data may be viewed and analyzed graphically. The Visualizer is described in the following section.
VISUALIZATION IN OVATION
OVATION provides an application specifically tailored to visualize the data captured by the probes described above.
OVATION graphically depicts the processes, threads, and objects of the application being instrumented. It allows the user to trace the messages between the distributed objects and permits the user to uniquely identify the source and the receiver of a message along with the sequence of requests and replies, including the time taken for each operation. The Visualizer can be used to load previously collected inter-process communication data and display it from multiple perspectives.
The primary view of the OVATION visualizer is the Remote Call Visualizer. The Remote Call Visualizer is a Java application that displays a graph of remote calls between clients and servers. It can display calls between individual objects in the context of the processes and threads of the distributed application.
Visualization of data in OVATION begins with the user loading a previously generated log file (dynamic data visualization while applications are still running is not currently supported in OVATION). The XML log file will contain data for each of the application processes being instrumented using OVATION. The Collector merges the remote method invocations into a single log file.
Figure 2 shows an example of interactions displayed in the Remove Call Visualizer window.
The Remote Call Visualizer allows the user to view object interactions from multiple perspectives such as object, process, component, and thread perspectives. A Tree View can also be utilized to expand and collapse the view by attributes (i.e., host, process, and distributed object).
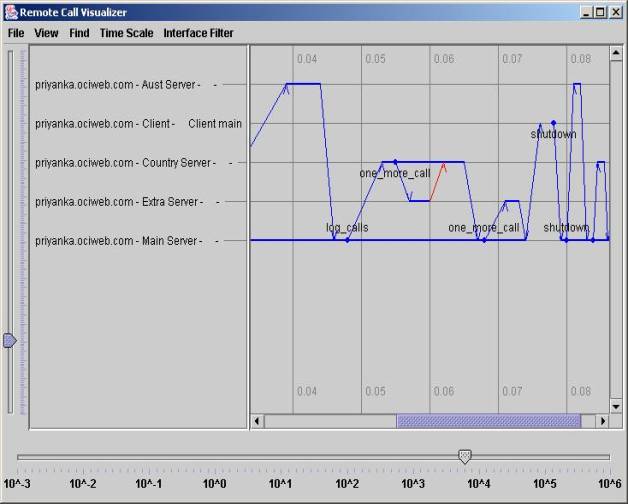
Figure 2: Main Visualizer View
MAIN VISUALIZER WINDOW
The display in Figure 2 shows the time scale on the horizontal axis and distributed objects on the vertical axis. In this case, five objects are represented as horizontal lines:
Aust ServerClientmainCountry ServerExtra ServerMain Server
Figure 2 shows an object (Main Server) invoking the method log_calls() on the Country Server object as an arrow oriented toward the invoked object (Country Server).
The Country Server object then invokes the method one_more_call() on the Extra Server object. The red line returning from the Extra Server indicates an exception was thrown in response to the invocation.
The time axis of the Remote Call Visualizer can be adjusted in several ways:
- The timescale menu can be used to adjust the scaling ticks on the time axis.
- The time axis can be expanded or contracted to allow finer-grained analysis of the message timing.
- The slider at the bottom of the display can be used to make the time axis contract or expand.
In the diagram above, the time scale "tick" marks show that the log_calls() invocation took approximately 20 milliseconds to complete.
THE 'FIND' CAPABILITY
While viewing large log files, it can be difficult to locate a particular call to a certain host, thread, operation, object, etc. The Find capability allows the user to search for an operation to a particular host, task, thread, interface, operation, or object.
The Remote Call Visualizer displays the first occurrence of the requested operation, highlights it in a thick blue line, and centers the display on it.
THE 'DWELL' CAPABILITY
The Dwell capability provided by the visualizer helps to determine the extent of an individual interaction. As the mouse passes over the blue and yellow lines of each CORBA call, the lines of the call turn green, and the operation name is displayed at the mouse location. This allows the user to easily trace the message between its source and target.
Using the right mouse button, the user can select from a set of filter operations that are based on the participants of the selected interaction. The options available for this filter operation include showing the forward and reverse call trees, showing only calls from this client, showing only calls to this server, and showing all calls.
OTHER DISPLAY FILTERS
The Remote Call Visualizer also allows the user to manually select specific IDL interfaces and operations to be displayed or hidden from the visualizer view port through the Interface Filter menu.
SEQUENCE DIAGRAM VIEW
The Sequence Diagram view of the OVATION Remote Call Visualizer depicts the interactions between objects using UML notation. This view can be selected by selecting Sequence Diagram View from the View menu. An example is shown below in Figure 3.
- The boxes aligned horizontally across the top contain the names of the objects for which data was collected.
- The solid arrows traveling from one object to another represent the CORBA remote calls made between processes.
- The names of the methods invoked in those calls appear in the middle of the arrows.
- Dashed arrows represent the return of the remote invocations.
- Calls that do not have dashed return arrows represent one-way CORBA invocations.
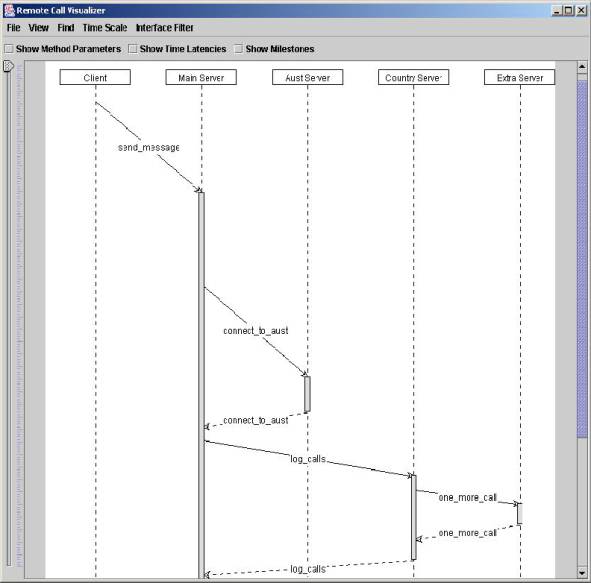
Figure 3: Sequence Diagram View
The gray bars that span the beginning and end of remote method calls are time loci. The size of these bars represents the relative amount of time spent within the execution of each call. The size of the time loci and vertical spacing of each of the method invocations can be controlled by moving the vertical time slider component along the left side of the diagram. Moving the slider down increases the time span ratio and spreads the method invocations and time loci further apart on the y-axis.
Three toggle buttons can be utilized to adjust the detail shown in the sequence diagram. The tool bar toggle buttons allow the user to show or hide method parameter types, the time latencies of CORBA remote invocations (in milliseconds), and user-defined milestone data that may have been gathered by the OVATION Milestone Probe.
Milestones appear in the sequence diagrams as a cyan-colored horizontal line that spans the width of the diagram with user supplied text appearing in the milestone line, as shown below in Figure 4, where a Milestone data point was collected with the user-supplied string 'Three Pings Called'.
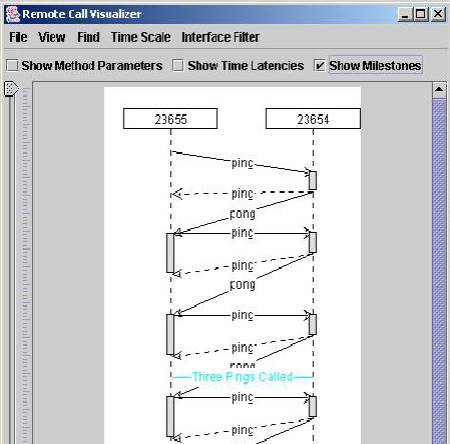
Figure 4: Example sequence diagram showing a 'Milestone' data point
EVENT CHANNEL VISUALIZATION
The OVATION Probe Framework is capable of gathering CORBA Event Channel data by utilizing the RTEC probe. Event Channel data gathered by the RTEC Probe identifies event supplier and event consumer relationships between components that are part of a distributed application.
When the OVATION Visualizer opens a log file containing RTEC Probe data, the Event Channel Visualizer window is launched showing the consumer and supplier relationships captured by the RTEC Probe.
Figure 5 shows an example of the Event Channel dependency visualizer and depicts the direction of an event from supplier to consumer. The Event Channel Visualizer only shows a single line for each event type from the supplier to the consumer. The event type is labeled alongside the arrow.
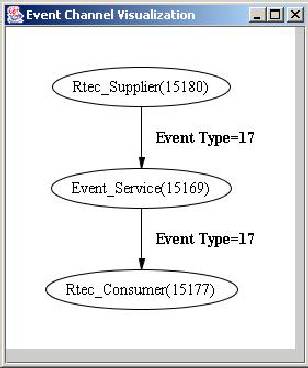
Figure 5: OVATION Event Channel Dependency Visualizer
OBTAINING OVATION
OVATION is a retired open source product compiled and tested on Linux (RedHat 7.2, GNU g++ v2.95.3 compiler) and Windows (XP, Microsoft Visual C++ v6). OVATION was written using a combination of Java, C++, and XML. In order to compile and install OVATION, several dependencies must be satisfied, including the installation of the following software:
- Sun Java 2 Standard Edition Development Kit,
- JacORB version 1.4.1,
- Ant (Open source Java build tool) version 1.5.1,
- OCI Version of ACE/TAO 1.2a patch 4 or later, and
- GraphViz [3].
Detailed instructions for the compilation and installation of OVATION can be found within the OVATION distribution (see $OVATION_ROOT/docs/index.html). Several examples are also included for testing and illustrations on how to utilize OVATION.
USING OVATION
Detailed instructions for how to utilize OVATION with an application are provided with the distribution. However, we briefly describe how to use OVATION with the Messenger example used throughout the TAO Developer's Guide [1] as an illustration.
The Messenger example consists of a server called MessengerServer that implements a simple Messenger interface, plus a client called MessengerClient that accesses and uses a Messenger CORBA object.
The ACE Service Configurator supports the creation of dynamically configured applications. Applications may comprise different components depending on directives provided to the framework. In the case of OVATION, the dynamic directive is used to trigger the loading and initialization of service objects from libraries.
For more details on the ACE Service Configurator, please refer to Chapter 18 of the TAO 1.2a Developer's Guide [1].
To start collecting data using OVATION, the user creates an svc.conf that indicates which directives will be dynamically loaded when the application is run. An example svc.conf file is shown below.
# Loads Probe Framework
dynamic Ovation Service_Object *OVATION:_make_Ovation () "MessengerServer"

# external triggering interface for the snooper probe.
dynamic Snooper Service_Object *Snooper_Probe:_make_Snooper_Plugin () ""

# Load Snooper Probe
dynamic Snooper_Probe Service_Object *Snooper_Probe:_make_Snooper_Probe () ""

# Load the Log Writer Probe
dynamic LogWriter_Probe Service_Object *LogWriter_Probe:_make_LogWriter_Probe () ""
This example shows directives for the Probe Framework, Snooper Probe, and Log Writer Probe. No code changes are necessary in this example in order to use OVATION.
SUMMARY
OVATION provides powerful data collection, visualization, and analysis capabilities for distributed applications. These capabilities can be employed to trace distributed method invocations for the purpose of pinpointing problems in both behavior and performance. It is intended to augment existing debuggers by providing a graphical representation of the end-to-end client server communication. It allows the user to pinpoint the cause of bottlenecks and deadlock by showing not only objects and their interactions, but the processes and threads that service the objects. OVATION, with its configurable framework, allows users to customize the collection and presentation of application data to suit their particular needs.
Acknowledgments
This article was co-written by OCI Software Engineer, Priyanka Gontla, and OCI Principal Software Engineer, Heather Drury.
The authors gratefully acknowledge the support of the Boeing Company for their management and substantial technical support of the OVATION project. Additionally we wish to give Boeing due credit for their funding and design support of the original tool that preceded, and was the genesis of, the OVATION toolset.
References
- [1] TAO Developer's Guide
- [2] OVATION User's Guide
- [3] Graphviz
