Data-Driven Documents with D3.js
By Tim Pollock, OCI Senior Software Engineer
December 2013
Introduction
D3.js is a JavaScript library[1] that makes it easy to bind data to a document, thus the name D3 for Data-Driven Documents.
There are several good tutorials on using D3 at D3js.org. This article provides an introduction by focusing on the simple D3 functions listed in the Selections portion of the API Reference[3] and provides some examples to clarify their use. It also includes some simple examples that provide an introduction to the powerful visualization capabilities when combining D3 with Scalable Vector Graphics (SVG)[6].
D3 allows you to select DOM elements and manipulate them using functions provided by the library. Elements are selected with select() and selectAll() methods, which return selections. Selections have operators that allow you to modify, add, or remove elements.
This excerpt from an IEEE paper[4] written by the authors of D3 provides a concise description of how it works:
"D3's atomic operand is the selection: a filtered set of elements queried from the current document. Operators act on selections, modifying content. Data joins bind input data to elements, enabling functional operators that depend on data, and producing enter and exit sub-selections for the creation and destruction of elements in correspondence with data. While operators apply instantaneously by default, animated transitions interpolate attributes and styles smoothly over time. Special operators called event handlers respond to user input and enable interaction. Numerous helper modules, such as layouts and scales, simplify common visualization tasks.
Here are the operators listed in the API Reference[3] that we'll cover in this article, along with excerpts from that page describing each one:
- Selecting DOM elements
- d3.select – select an element from the current document
- d3.selectAll – select multiple elements from the current document
- Registering event handlers
- selection.on – add or remove event listeners for interaction
- Changing element attributes
- selection.attr – get or set attribute values
- selection.classed – add or remove CSS classes
- selection.style – get or set style properties
- selection.property – get or set raw properties
- selection.text – get or set text content
- selection.html ‐ get or set inner HTML content
- Joining data to elements and accessing the results of a join
- selection.data – get or set data for a group of elements while computing a relational join
- selection.enter – returns placeholders for missing elements
- selection.exit – returns elements that are no longer needed
- Adding and removing elements
- selection.append – create and append new elements
- selection.insert – create and insert new elements before existing elements
- selection.remove – remove elements from the document
- Performing transitions
- selection.transition – start a transition on the selected elements
The basic workflow when using D3 is to select elements using CSS selectors, then bind data to them with the data() operator. That results in two selections representing data that was not bound to DOM elements, and DOM elements that the data() operator did not provide data for.
Unbound data is accessed with the D3 enter() operator. Similarly, unmatched elements are accessed with the D3 exit() operator.
The enter() operator lets you add additional elements for each unbound data member, and the exit() operator lets you remove elements that do not have corresponding data. That results in code that is structured something like this:
      // Select existing <p> elements and join some data to them.  This returns a selection object.
      var selection = d3.selectAll("p").data(someData);

      // Append new <p> elements for each data element that was not bound to an existing <p> element.
      selection.enter().append("p");

      // Remove <p> elements that did not have corresponding data elements.
      selection.exit().remove();

      // Set the text in each <p> element.
      selection.text(function (d) { return d; });
Each D3 selection has a container named __data__ that holds the data that was joined to the selection with the data operator. The function passed to a selection operator, such as function (d) { return d; }, returns one item from __data__ for each node in the selection that the function is called for.
In this article we'll begin with some simple usages of the selection operators shown above, then move to updating elements with data(), enter() and exit(). We'll finish with some visualization examples using SVG.
The code for the examples used in this article is available for download here.
Getting Started
The best way to learn something new is to experiment with it, so to get started using D3 you can create an html file with the following content and use it to execute D3 in a browser console:
- <html>
- <head>
- <title>d3</title>
- <script src="http://d3js.org/d3.v3.min.js" charset="utf-8"></script>
- </head>
- <body>
- </body>
- </html>
That will load an empty page having the Javascript necessary to use D3. After loading that empty page you can modify it by executing D3 functions from the development console on your browser. While we will be using Chrome in this article, where the console is opened by pressing the F12 key, a browser console is available for other browsers, such as the Firebug [7] plugin for the Firefox browser.
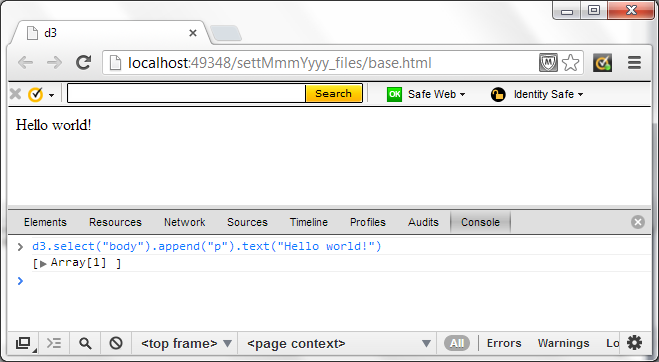
As a simple example, you can select the document body and append text to it by entering the following in the console:
d3.select("body").append("p").text("Hello world!")In the example above, d3.select("body") returns a selection containing the body of the page. The select() function returns a D3 selection, which can have other operators chained to it by following it with a dot, as in select("body").append("p"). The append("p") operator adds a<p> paragraph tag and the text("Hello world!") operator adds text to that paragraph. Here's a screenshot showing that chain of D3 operators in the browsers development console:
The remaining examples in this article provide code that you can drop into the console if you want to run it as written or with your own modifications. Getting comfortable with using the console will be helpful when debugging any D3 code that you write.
A Simple D3 Example
The next example handles a button click by changing the button text and the background color of the page. The D3 select() function takes a CSS selector (in this case #btn) and returns a D3 selection. That selection has an operator named on() that allows you to define a handler for an event (in this case a click event) and a function that will be executed when the event occurs. The function defined for the click handler in this example below changes the button text and toggles the background color of the page between white and yellow. Within the function, this refers to the selected element (the button), so this.value gets and sets the button text. The d3.select("body") statement returns a D3 selection containing the body element, and the D3 attr() operator allows you to modify attributes of that element (the background color).
- <!DOCTYPE HTML>
- <html>
- <head>
- <script src="http://d3js.org/d3.v3.min.js" charset="utf-8"></script>
- </head>
- <body>
- <input type="button" id="btn">Click Me</button>
- <script type="text/javascript">
- d3.select("#btn").on("click", function () {
- var body = d3.select("body");
- if (this.value == "Click Me") {
- this.value = "Click Again";
- body.attr("bgcolor", "yellow");
- }
- else {
- this.value = "Click Me";
- body.attr("bgcolor", "white");
- }
- })
- </script>
- </body>
- </html>
(In the examples that follow, just the code within the <script> tags will be shown.)
The code above results in the page framed in below. Click on the button to change the background and the button text.
[functionality removed since original publication]
That example shows how you can select DOM elements and change their attributes, but the real power of using D3 is in its ability to bind data to elements. The next example demonstrates how to do that.
Binding Data to DOM Elements
The example above doesn't do anything with the D3 data(), enter() and exit() functions, so it isn't very interesting and could have easily been done with jQuery or by using the DOM API. The next example shows how data is joined to DOM elements using D3. It creates one, two or three paragraphs containing the text supplied by an array of strings. We'll step into the code for this example to see how it works. The function that updates the DOM is shown below:
       var loadParagraphs = function (theData) {
            var paragraphs = d3.select('body').selectAll('p').data(theData);
            paragraphs.exit().remove();
            paragraphs.enter().append('p');
            paragraphs.text(function (d) { return d; });
        };
[functionality removed since original publication]
That example uses the D3 select, selectAll, data, exit, remove, enter, append and textoperators.
You can test the example shown above in the browser console by entering the following:
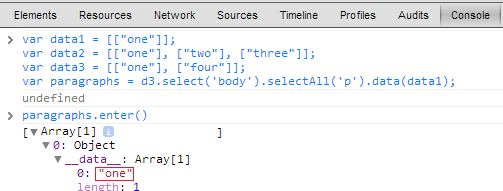
- var data1 = [["one"]];
- var data2 = [["one"], ["two"], ["three"]];
- var data3 = [["one"], ["four"]];
- var paragraphs = d3.select('body').selectAll('p').data(data1);
- paragraphs.enter();
Entering paragraphs.enter() allows you to see the enter selection (shown below). You can see that it added one Object whose __data__ member contains the data that had no corresponding DOM element.
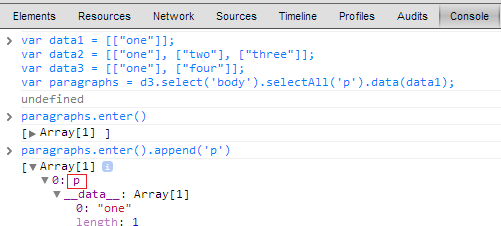
Entering paragraphs.enter().append('p') in the console will change the Object to a <p> element. Looking at the console shows that element:
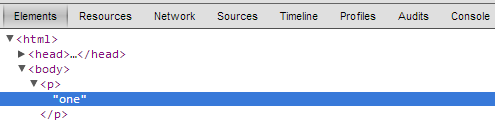
Finally, entering paragraphs.text(function (d) { return d; }) sets the text of the <p>element to the value of the corresponding __data__ member:
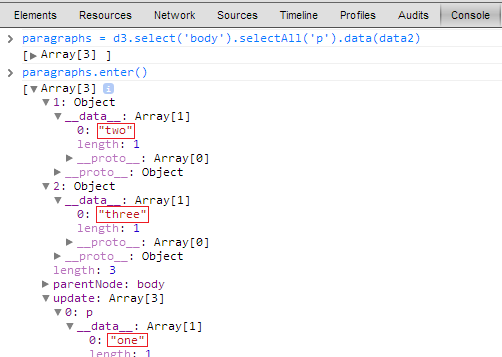
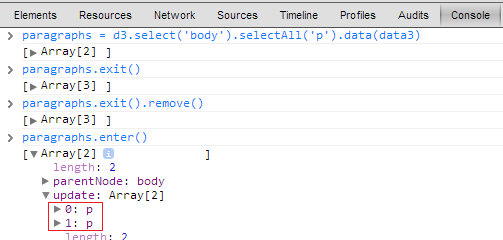
You can load the second data set by entering paragraphs = d3.select('body').selectAll('p').data(data2). By entering paragraphs.enter() you can see that two Object nodes were added for the two new data members that didn't have corresponding <p> elements, and that the update selection contains the existing paragraph node:
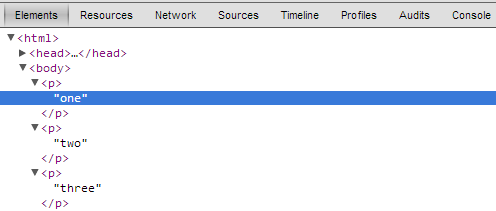
Like the previous example, entering paragraphs.enter().append('p').text(function (d) { return d; }) will change the Object nodes to paragraphs and set their text:
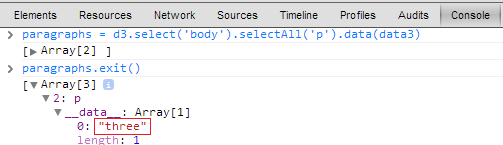
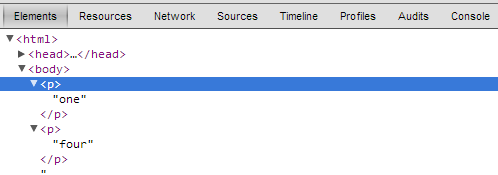
You can load the last data set, which has one fewer paragraph, by entering paragraphs = d3.select('body').selectAll('p').data(data3). If you then enter paragraphs.exit() you will see that one paragraph is in the exit selection:
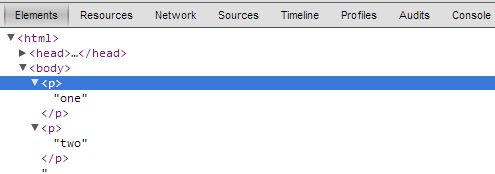
Entering paragraphs.exit().remove() will remove that paragraph:
By entering paragraphs.enter() you will see that no new Object nodes were added, and that the update selection contains the two remaining paragraph nodes:
Finally, entering paragraphs.text(function(d) { return d; }) will update the text of those two remaining paragraphs:
Another Paragraph Example
The next example is similar to the previous one and simulates a page that dynamically displays paragraphs. It creates some data defining a random number of paragraphs of made-up words. Clicking the Click Me button executes a function that gets an array of paragraphs, then binds them to <p> elements, adding paragraphs if there are more members in the array than paragraph elements, and removing paragraphs if there are fewer paragraph elements than array members. The full source can be viewed by clicking the View Source Details button below the example. The button click event handler, which demonstrates the D3 functionality, is shown below:
- d3.select("#btn").on("click", function () {
- setParagraphs();
- })
-
- function setParagraphs() {
- // Select paragraph elements and bind paragraph data to them.
- var paragraphs = d3.selectAll("p").data(getParagraphs());
-
- // Add paragraph elements when there is more data than elements.
- paragraphs.enter().append("p");
-
- // Remove paragraphs when there is less data than elements.
- paragraphs.exit().remove();
-
- // Set the paragraph data.
- paragraphs.text(function (d) { return d; });
- }
[functionality removed since original publication]
Binding Table Data
The next example shows how to load data into a table. The example has four buttons, each calling a loadTable() function with a different set of data. The data passed into loadTable() is an array of arrays representing table rows (you can see the full source code by clicking the View Source Details button below the example window).
The function used in this example is shown below:
      var loadTable = function (tblData) {
            if (typeof tbl == 'undefined') {
                d3.select('body').append('table').attr('id', 'tbl');
            }

            var tbl = d3.select('#tbl');

            var rows = tbl.selectAll("tr").remove();
            rows = tbl.selectAll("tr").data(tblData, function(d) { return d; });
            rows.enter().append("tr");

            var cells = rows.selectAll("td").data(function(d) { return d; });
            cells.enter().append("td").text(function(d) { return d; });
        }
The loadTable() function creates a table if one hasn't been created yet, then it selects all rows from that table and binds the passed-in data to the rows selection. The rows.enter() function adds additional rows if there are more arrays in the data than there are rows. The exit() function removes rows that don't have corresponding data.
Each row has an associated D3 __data__ member that contains an array of row data (the cells in each row). The data operator chained to the rows.selectAll operator defines a function that returns the row data and binds it to <td> elements. Each <td> element then has an associated D3 __data__ member that contains each cell's data. The cells.enter().append("td").text operator chain sets the text of each <td> node.
This results in a HTML table containing the data passed into the D3 data operator. You can click on a Load table button below to see each table displayed.
[functionality removed since original publication]
To take a deeper look at that example, and to see the data associated with binding data to a table, you can enter the following commands in the development console:
- var tbl1 = [[2048, 23, 173, 2744], [7, 20201, 95, 8684], [69, 3920, 8196, 45], [1021, 9656, 311, 342]]
- d3.select('body').append('table').attr('id', 'tbl')
- var tbl = d3.select('#tbl')
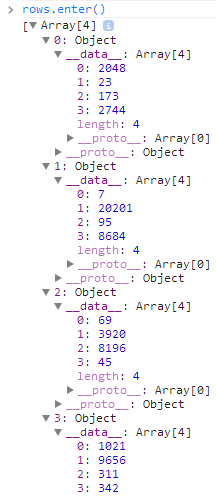
- var rows = tbl.selectAll("tr").data(tbl1, function (d) { return d; })
- rows.enter()
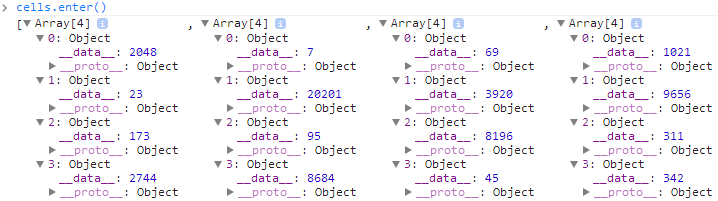
After entering rows.enter() you will see that there are four Object nodes, each having an array of data associated with its __data__ member:
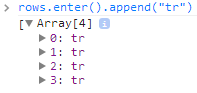
Entering rows.enter().append("tr") will change those Object nodes to <tr> nodes:
Entering these commands will join each rows array data to Object nodes and will allow you to see the enter selection:
- var cells = rows.selectAll("td").data(function (d) { return d; })
- cells.enter()
After entering cells.enter() you will see the Object nodes and their associated data:
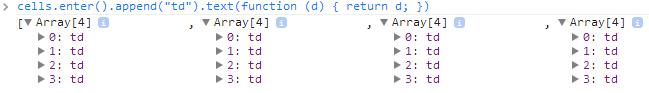
inally, entering cells.enter().append("td").text(function (d) { return d; }) changes the Object nodes to <td> nodes and sets the text of each to one of the array elements:
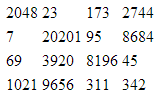
That results in the following table being rendered:
Visualization with D3
One of the strengths of D3 is its ability to efficiently produce dynamic data visualizations. The library has a rich range of functions for creating graphs and other types of visualizations.
The next example shows how to draw a simple pie chart. This example is the first in this article that uses SVG. Future articles will go deeper into D3 visualization, so this example is meant only to show how easy it is to create a graph with D3 and SVG.
[functionality removed since original publication]
The final example in this article goes a bit further into visualization by simulating a dynamic web page that receives a stream of data and uses it to update the color, size and position of circles. This example shows how easy it is to provide a dynamic data representation. In a real application the incoming data could be obtained by periodically calling the asynchronous D3.json function to receive updates from a server. To run this example, click the Start button.
[functionality removed since original publication]
There are many interesting visualization examples on the D3 Gallery page [2]. The one shown below comes directly from the Force-Directed Graph example [5] on that page. In that example you can click on a node and move it around in the window while the other nodes reposition themselves in response to that action. This is a great example of the power of D3.
[functionality removed since original publication]
Summary
This article has provided an introduction to using the D3 Javascript library, showing how it joins data to DOM nodes to add or remove elements to match the data. The article focused on the basics and only touched on the visualizations that are possible with the many functions that D3 provides. To learn more, explore the links below which provide D3 and SVG documentation, along with many additional examples of how D3 can be used to create efficient and dynamic web pages.
