Planning for the Unpredictable: Project Estimation Simplified with a Middle-Out Approach
By Joe Epplin, OCI Principal Architect and Cloud Practice Lead
February 2020
Introduction
Accurate estimation is fundamental for healthy, durable agreements between stakeholders and providers. Decades of attention have been paid to this competence with mixed results; information technology professionals still have difficulty consistently projecting the total cost to deliver a solution of any reasonable size.
Often organizations attempt to confront this challenge with big, upfront design on projects where later components are not even understood at the time of estimation. Failures have been attributed to all of the following (among other factors):
- Lack of shared context between estimators
- Overlooking the cost of operational support requirements
- Failure to manage project changes as they occur
- The fundamental challenge inherent in measuring the unknown
Attempts to address these failures have had uneven success. They have brought forward improved understanding over time, but few formalized approaches attempt a holistic view across all dimensions of the estimation challenge, including:
- Efficient application of wisdom and expertise
- Enforced decomposition at an estimation useful level
- Pressure to avoid over-designing during estimation
- Working from what is known to what is needed
This article explores the successful ingredients in accurate project estimation. More than that, it describes how to blend these ingredients together in such a way that projects of all sizes, domains, and maturity levels can delight stakeholders while empowering providers.
In a nutshell, this process applies the t-shirt sizing abstraction to well-architected solution pieces and maps these sizes to the agile point-sizing Fibonacci numbers as a basis for rough size but comparable numeric values, which can then be scaled to effort-hour estimates based on previous project experience and frequently overlooked estimation gaps.
Solution Design
A premise of this proposal is the “middle-out” solution design pattern articulated by Nick Gall at a Gartner Enterprise Architecture Summit in 2006 [Gal01]. The design pattern was not specifically targeted to solving the estimation dilemma at the conference, but it turns out that many of its features are beneficial to successful estimation.
Nick’s concept is that tasks that pertain to rapidly evolving systems, but nevertheless require planning and coordination, cannot be addressed top-down nor bottom-up; they need to be approached “middle-out.”
Top-down architecture was good in an era when business requirements were long lived and optimization of stable processes was the primary goal. Think mass production. However, in today's environment, when agility in the face of volatile requirements is the primary goal, designing top-down is often a mistake.
Figure 1. Design situation for which top-down is appropriate: simple, fully-understood system requirements, unlikely to change

On the other hand, bottom-up works well when you really can't plan for the future at all, such as a project with no budget and no milestones. The downside is that this approach is extremely inefficient and often incredibly fragile. But it does produce working software quickly because decision making is decentralized and very likely uncoordinated.
Figure 2. Typical result of bottom-up design (unplanned urban development): inefficient, fragile, chaotic

A better approach to either of these is "middle-out," which defines the decentralized principles for composing diverse micro-solutions into open-ended macro-solutions.
Think mass innovation.
Think microservices.
Figure 3. “Middle-out” situations; an abstraction serves to mediate between too much and too little detail

As Nick presented, “The most difficult architectural decision that one can make, hence the most fundamental, is that of predicting which constraints will cause the least difficulty now and in the future. That is, will barely perceptible constraints that we impose today become intolerable limitations in the not too distant future? This is the essence of a 'timeless' architecture — that it is derived from deep principles constraining both the source domain (technology) and target domain (business). By deriving architectural constraints only from such deep, long-lived principles, we ensure that the [impact] and tempo of change for the architecture match those of the domains to which it is applied.”
This dynamic is at the heart of estimation challenges we have struggled with for decades.
The Estimation Abstraction
The agile software development methodology provides us with an excellent abstraction that helps us apply the middle-out principle to sizing a project.
A story point is a metric used in agile project management and development to estimate the difficulty of implementing a given user story, which is an abstract measure of the effort required, risk, and complexity to implement it. In simple terms, a story point is a number that tells the team about the difficulty level of the story [Vis02]. This metric is typically applied on a smaller scale than for full system project scope, but the principle that it applies for relative sizing is directly applicable.
During the initial approach at estimating the overall size of a solution development engagement, much more is unknown than known by the potential delivery organization. This is similar, but on a larger scale, to the estimation task put in front of an agile sprint team member. That member can expect a typical number of surprises once a development task is undertaken, but this does not prevent that developer from having a fairly good idea of the size of that task.
A CAD/CAM Component Sizing Example
Consider a project to add two new curve types to a geometry system. Suppose the existing system has code to support straight lines, parabolas, and circles. Without being a CAD/CAM solution domain expert, the following table of historic development sizes is intuitively clear.
Figure 4. Existing system example
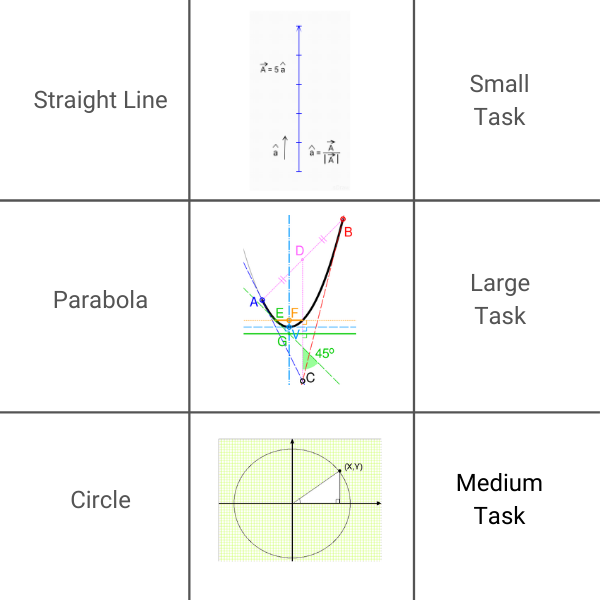
A quick check on historic information can confirm the relative sizing understanding. Please note, though, that at this stage in the estimation process, the specific actual numbers of hours to develop these system features is less important than the relative sizings. We can get back to the numbers later.
Adding curve types of hyperbola and ellipse can be sized with a minimal amount of CAD/CAM solution domain expertise. A guess at the estimated task sizes is in the third column in orange. We will be able to work with this table to make a durable agreement with our stakeholders.
Figure 5. Proposed additions to existing system
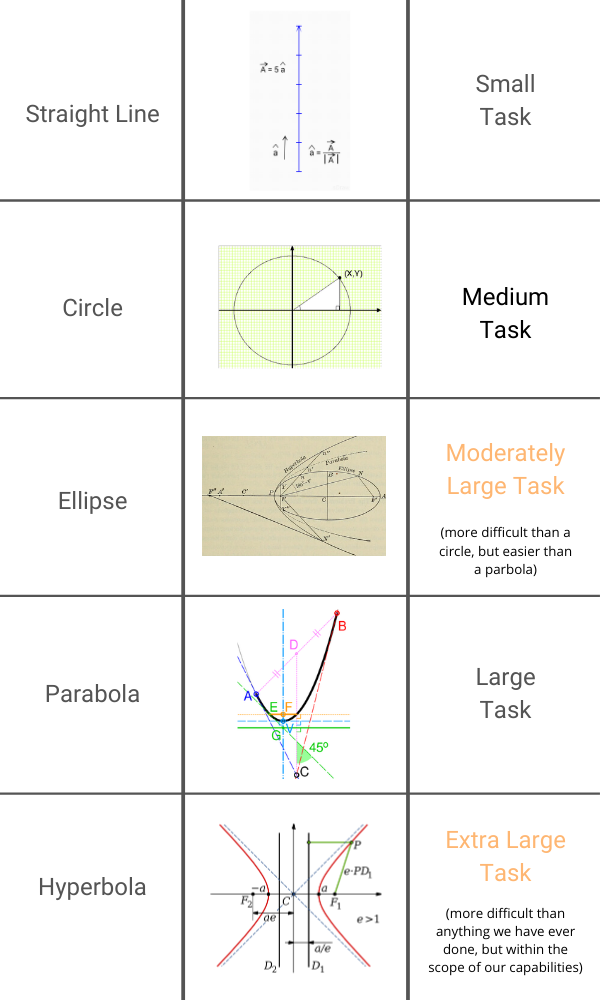
The textual expression of the comparative sizes is an abstraction that conveys enough information for us to use as we nail down the estimate.
- It is not completely top-down and abstract, since it captures real information about the domain elements.
- It is not completely bottom-up and literal, since it does not start with specific numbers of hours or days.
- Rather, it works in between these two extremes: middle out.
From this fairly easy-to-obtain initial information, we can work our way into specific numbers, while maintaining an overall top-level view of the not completely understood innovation being pursued. There will certainly be unforeseen problems and efforts during the development of ellipse and hyperbola software, but it will most likely be on the same scale as was experienced during the development of the straight line, circle, and parabola.
This is a core insight in agile methodology that can be applied to larger-scale system development on the whole.
Identifying the Main Pieces
Ideally, the launch of a new project is driven by business objectives that connect an information technology portfolio to the strategy of an enterprise [Sca03].
Strategic themes are the key differentiators that drive the future state of a portfolio. Strategic themes tend to be fairly stable over a one or two year timeline. As a reflection of enterprise strategy, they don’t change that often; annual updates seem to work for most enterprises [Sca04].
A successful approach for achieving this alignment of business and technology strategy is the Scaled Agile Framework (SAFe) [Sca03]. This article cannot pretend to represent the benefits and features of SAFe as effectively as Scaled Agile Inc., but the framework is referenced here as one possible source of identified backlog items that need to be delivered and which provide us with a high-level breakdown of the component features delivered through a development project.
Figure 6. SAFe processes that provide a backlog of desired features
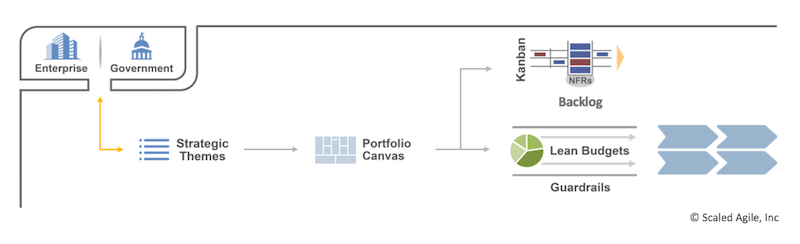
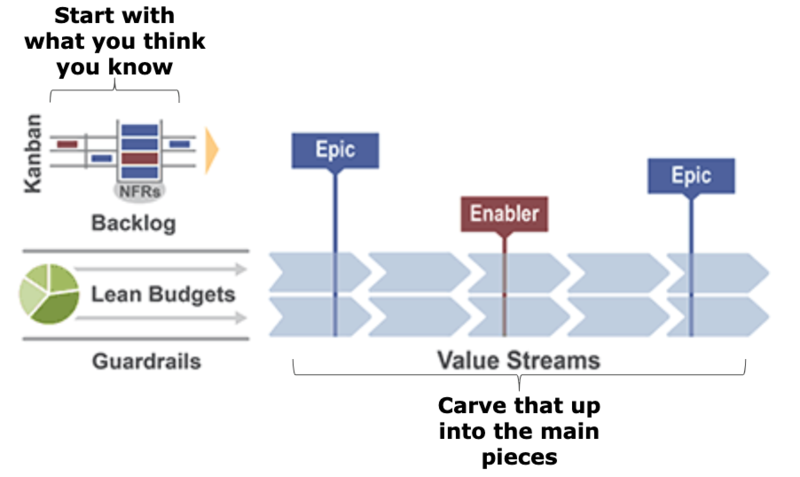
Based on this shared understanding of strategic themes and their derived epics, features, and enablers, a middle-out estimation process can consume this high-level breakdown of efforts as the main pieces needing size assessments.
Figure 7. High-level epics, features, and enablers are the main pieces to be estimated
T-shirt Sizes
One of the key elements to successful estimation is for the approach to feel comfortable psychologically. Participants in the production of an estimate can tell when any of the following are present:
- Too much is being promised for too little
- Insufficient discovery has occurred
- The team has not bought into the commitment
- Too much time has been invested in an overly speculative opportunity
Any combination of these decreases the position satisfaction of the participants, and very likely increases the amount of unproductive stress for the team.
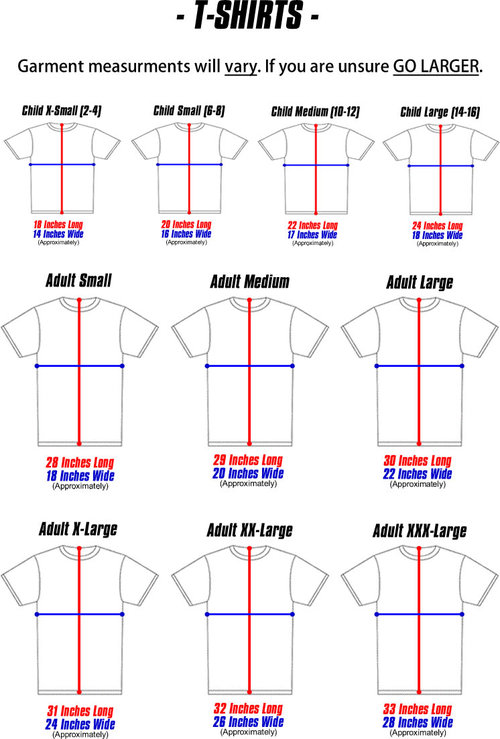
A useful technique for avoiding this quandary is “t-shirt sizing” the main pieces of the project. T-shirt sizing is based on the concept of binning. The bins are typically assigned labels corresponding to those commonly used with t-shirt sizes: extra small, small, medium, large, extra large, etc. [Inn05]. In the quest to collectively get their arms around the size of an endeavor, an estimation team can usually tell the “t-shirt comparative size” long before it can put a number of hours estimate on each of the main pieces.
Figure 8. An intuitive, scalable, objective way to express relative sizing
The third column in the “CAD/CAM Component Sizing Example” above uses this abstraction without naming it. It mentions small, medium, large, and extra-large as descriptions of the relative sizes of the effort to deliver differing geometric curve types. It also mentions “moderately large,” which is not a typically used shirt size.
This is where the use of t-shirt sizing helps facilitate just-in-time or just-enough language consensus for effective estimation. At this stage in the estimation process, we do not have enough information to articulate integer numbers of hours, but we can work within the set {extra small, small, medium, large, extra large, 2X large, 3X large}. Assigning this relative size to each of the main pieces is a tangible, reasonable, transparent, just-enough task that helps us make progress without confusion or stress for the team
Why Fibonacci Numbers?
Nature and common sense help us match t-shirt sizes to numbers. The Fibonacci sequence is a set of integers for which each number in the set is the sum of the previous two. For our purposes, the set {1, 2, 3, 5, 8, 13, 21, 34, 55, 89, …} is great for digitizing the relative sizes of pieces.
The reason for using integers in the Fibonacci sequence is that they truly reflect the middle-out abstraction defended in the opening sections. From any digit in the sequence, you can rely on the previous digit to be around 1.6 (ɸ) times smaller and the next one to be 1.6 times larger. This becomes more accurate the further you go into the sequence. This sounds like just a curiosity, but it is actually a strong attribute of the sequence; as you break down larger solution pieces into smaller ones, as long as you stick with t-shirt sizes mapped to Fibonacci values, your middle-out “in between” view of decomposition stays consistent.
Figure 9. The underlying consistency of the Fibonacci Sequence; the ratio is ɸ.
A case can be made that any geometric sequence has this property. For any number in a geometric sequence, the previous number is the common ratio times smaller, and the next one is the common ratio times larger. What is special about the Fibonacci sequence is that all of the values are whole numbers, and the common ratio (ɸ) in this case causes the additional key property that each number in the set is the sum of the previous two. This means that pieces can be divided without loss of estimated effort into two parts sized the previous two smaller sizes, as long as the division truly reflects the project content, and recombined to produce a consistent total.
The disposition of unknown effort costs through this process of decomposition warrants further consideration.
A large piece of project work prior to being broken into two smaller ones contains an undetermined amount of unknown effort. (Of course!) We are relying on the expertise of the estimation team to rationally break this larger piece into two smaller pieces – pieces that are highly cohesive and loosely coupled. This estimation approach assumes that either the unknown elements of the original larger piece will remain unknown in the two smaller replacement pieces, or they will be clarified through the decomposition process so that the size estimates for the two smaller pieces will be improved. Put another way, this approach to decomposition assumes that this process never results in creating more unknowns than already existed in the larger piece; competent solution architects must be involved.
This is “middle out” in that at this stage in the process, we have abstracted away from specific effort numbers, but we are progressing our understanding of the project, and the process can jump into the Fibonacci numbers at any place in the sequence; because they constitute an ‘iterated sequence,’ each number is a combination of previous numbers, rather than being calculated by a formula based on its position in the sequence. The abstraction forces attention to comparative sizing and discourages early attention to specific hour-effort estimates. Moreover, there is no pressure to subdivide the pieces more than is currently understood; each t-shirt size corresponds to an easily usable Fibonacci value.
Figure 10. Table of sample mappings of t-shirt sizes to Fibonacci values
| T-Shirt Size | Rough Understanding Fibonacci Mapping | Tighter Understanding Fibonacci Mapping |
|---|---|---|
| extra small | 1 | 5 |
| small | 2 | 8 |
| medium | 3 | 13 |
| large | 5 | 21 |
| extra large | 8 | 34 |
| 2X large | 13 | 55 |
| 3X large | 21 | 89 |
At this stage in the estimation process, some numeric comparable values begin to emerge for the established pieces of the solution. The team responsible for the estimate will often observe an unevenness in the emerging picture.
For example, a piece designated as “3X large” may seem generously allocated; its size may need further analysis through further decomposition. Perhaps the two pieces into which it has been divided will justifiably be “extra large” and “2X large.” But maybe it will become clear that one piece is actually “large” and the other is “2X large.” This is not only OK, it is the intended result of the approach! This middle-out view of the estimation exercise is exactly the planned effect of using the t-shirt size abstraction. It enables the team to openly share insights with a language “in between” specific effort hours and vague generalities.
Good Psychology
Teams love this concept. It “feels right” as an estimation approach. It benefits from several important human dynamics.
- Each participant is asked to contribute what he or she knows and no more.
- This is a framework on which what is known is transparently captured and published; there is no place or need in this collaborative phase for hidden multipliers and layers of management control.
- This is a uniform approach, regardless of the scale and domain of the project. Estimators can continue to grow in experience and process maturity through projects of varying size and domain.
- Participants grow in confidence in and commitment to the estimate over time. This is in stark contrast to fairly common “just give me a number” directives. Management has visibility to the progress and reasonableness of the estimation process all along and can determine when “good enough” has been achieved, without a destructive level of need for deadline pressures.
- This is an estimation approach that encourages continuous attention to technical excellence and good design. Most solution development organizations delight in being involved with this context.
Figure 11. Good psychology is essential for sustainable results

Program Increment (PI) Planning
The concepts presented here seem very close to SAFe Program Increment Planning [Sca06]. They certainly overlap regarding face-to-face teamwork, aligning all team members to a shared mission and vision, having a standard agenda, combining business and technical drivers, expecting that progress occurs over iterations of effort, and periodic reflection regarding effectiveness. It is tempting to simply drop the SAFe PI Planning guidance right here; it all applies!
In fact, it is useful to think of this estimation process as the first PI Planning session for a project. Software Lifecycle specialists have noted that the Scaled Agile Framework has the virtue of aligning the responsibility for the implications of an estimate with the team that will deliver the estimated project: a “virtuous responsibility connection.” Since this estimation exercise is often not performed by the eventual delivery team, the lack of the virtuous responsibility connection inherent in SAFe must be mitigated; this actually is not the first PI Planning in a project, and teams should expect to execute the project if/when it is approved according to their standard delivery process. In the meantime, we must take into consideration the risk that the estimation team will lack delivery commitment.
The agile process promotes a commitment by the delivery team to the successful completion of the stories in a given sprint by involving the team in the effort and difficulty estimation and formalizing the commitment to success through sprint planning, daily scrum, sprint review, and sprint retrospective ceremonies.
The estimation process for full solutions should ideally include analogous activities, but oriented to and incenting tasks supporting accurate estimation instead of software development. For this proposed estimation process to succeed, the estimation team must commit to all of the following:
- Establishing a cadence for planning meetings
- Meeting daily to discuss progress and issues
- Having checkpoint meetings with stakeholders
- Reflecting frequently on how this process is working and how it can be improved
But the factor most critical for success and most difficult to achieve organizationally is to be sure that the incentive for accurate estimation by the estimating team is just as strong as the incentive for the development team to deliver awesome working software. The estimating team must have the dedication to success for its estimations that an agile team has for working software. There needs to be an organization-wide visibility and accounting for estimation results.
Once this is in place, the remaining best practices affecting successful estimation are straightforward:
- Involve your experts
- Map your Fibonacci numbers to hours
- Make sure the less visible “non-functional” requirements are considered
Involving Expertise Appropriately
Usually, a valuable solution development engagement involves technology and business acumen of varying types. It is important to have representation on the estimation team for all practices that are expected to be used, and to add or remove representatives as the proposed solution becomes more clear.
This observation has specific implications for an organization whose mission is delivering excellent software solutions. On the one hand, every individual in the organization has unique qualities and strengths. There is pressure to include every person on every estimate. This is clearly overly expensive and burdened with too much communication. On the other hand, typically the types of expertise being brought to bear on a solution can differ fairly much and many highly useful innovations cross domains.
For these reasons, an accurate estimation approach involves a team of technology practice leaders and business domain specialists. Because this team is most likely cobbled together with people who have other responsibilities, the estimation approach needs to enable them to contribute to the product exactly when they are needed and no more. This is best ensured through a combination of engagements including:
- Planning meetings that include resource considerations
- Very quick daily meetings to discuss progress and issues
- Checkpoint meetings with stakeholders that optimize resource utilization
- Frequently reviews of how well this process is working and how it can be improved
Clearly, overall best estimation results will be obtained when the business and technology experts most knowledgeable for each piece are responsible for the estimation of that piece, or when they work with an excellent solution architect to improve the decomposition structure of that area of the candidate architecture.
Convert to Hour Effort Values
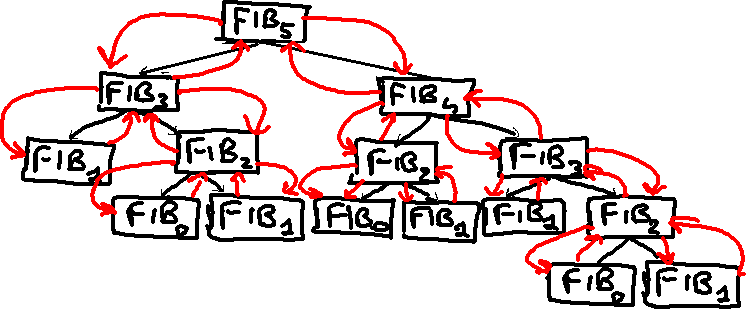
At this point, under one visualization or tabular data tool or another, you should have information that looks pretty much like the following illustration for each piece of your solution design. There is an overall value for each piece (in this case, FIB₅), and all of these piece sizes are consistently sized, but these sizes have no “real world” units, such as hours, days, or years.
Figure 12. Rolling up the results
What we need now are one or two mid-sized pieces in the mix for which we have empirical data, or at least a very confident understanding to support a Fibonacci/hours mapping.
Suppose two of your mid-sized pieces are t-shirt sized “large,” and your historical experience regarding the delivery of these two is that one took 200 hours and the other took 220 hours. Suppose further that we have decided to use the “Tighter understanding Fibonacci mapping” (Figure 11 above), so our “large” pieces map to the Fibonacci number 21. In this case, each Fibonacci numeric value in our estimations corresponds to 10 effort hours in the project. Since we are able to work with two historic values, we can average them and then divide that average by the Fibonacci value corresponding to “large” (21).
Armed with this mapping, we can compute an overall project-level estimate. We total the Fibonacci values for all of our pieces and multiply by 10 to land on an expected number of hours. Each practice represented through the estimation team has contributed its wisdom and experience to this final value and has confidence that its practice can deliver its pieces successfully and reasonably close to its computed level of effort.
Non-Functional Requirements
Every delivery organization is different. Some naturally consider the non-functional enablers for a piece of a project to be essential to each piece, and others do not. The risk area here is hosting, testing, data migration, user training, error management, and system tuning. The ones that think more comprehensively bake these “non-functional” tasks into their baseline reference piece Fibonacci/hours mapping. In that case, our total effort estimate is the sum of all of the pieces.
Other organizations, though, concentrate primarily on the happy path capabilities for project completion; the development activities that directly contribute to capabilities visible to solution users. In that case, the sum of all of the estimated pieces will be too small to reasonably deliver the mature solution. These organizations will need to address this gap with a multiplier to be applied to the total of the pieces. Over decades of large scale solution development projects in many domains, technology stacks, and team competencies, we have arrived at a reasonable initial multiplier of 1.6. Over time, this type of organization should tune this multiplier to their specific context, but that is a good initial starting point.
Pulling It All Together With One Final Example
How about one more example that shows this entire process at work?
Suppose we need to estimate the effort level to enhance a scheduling system with some machine learning capabilities. Our Program Management Office talks this over with a few Solution Architects (your titles may vary) and establishes the following initial breakdown of the pieces and first cut at the practices or specialties which seem most appropriate for estimating these pieces. These supporting teams identify their best estimators given what is known. They meet to be sure they all understand the process and the proposed innovation. They review the proposed decomposition into pieces, and begin daily meetings to discuss progress and issues.
Figure 13. What needs to be estimated
| Piece | Practice / Specialty |
|---|---|
| Account Management | Business Analyst |
| Profile | UX |
| Rules Engine | Business Analyst |
| Machine Learning | ML |
| Workflow | Software Engineer |
| Reporting | Business Analyst |
| ETL | Interfaces |
| Usage Incentive | Business Analyst |
| Space / Size Computation | Software Engineer |
Piece Refinement and T-shirt Sizing
Our estimation team members dive into understanding the requirements so that they can perform t-shirt sizing.
- Further study by the Business Analysis estimator reveals that we misunderstood the expectation that users of this utility would be incented to perform certain tasks, so that piece can be removed from the list.
- Also, it comes to light that the floor space of the rooms necessary to host the events being scheduled is already computed and stored in the database, so no “space / size computation” is needed.
The estimators share their initial size impressions with other team members whenever it seems likely that they need this help, and after a few hours of attention to this process, the following information has been produced.
Figure 14. Initial size estimate
| Piece | Practice / Specialty | T-shirt Size |
|---|---|---|
| Account Management | Business Analyst | Extra small |
| Profile | UX | Small |
| Rules Engine | Business Analyst | Large |
| Machine Learning | ML | XL |
| Workflow | Software Engineer | 3X large |
| Reporting | Business Analyst | Medium |
| ETL | Interfaces | Large |
At this point, the estimation team has a checkpoint meeting with the project stakeholders; at least the Program Management Office and possibly the Product Manager for the project.
During this checkpoint meeting, all agree that the estimates seem pretty realistic, except the "3X large" value for the “Workflow” piece. Because her project work is absorbing all of her attention, the Software Engineering estimator for this piece is unable to attend the checkpoint meeting. Thus, a member of the Software Engineering practice is requested to help with this particular estimate, preferably someone with workflow experience.
Renewed, more-informed attention to this piece settles more realistically on a “Medium” estimate.
Now the t-shirt sizes for the pieces are as follows.
Figure 15. Estimates improved through conversations
| Piece | Practice / Specialty | T-shirt Size |
|---|---|---|
| Account Management | Business Analyst | Extra small |
| Profile | UX | Small |
| Rules Engine | Business Analyst | Large |
| Machine Learning | ML | XL |
| Workflow | Software Engineer | Medium |
| Reporting | Business Analyst | Medium |
| ETL | Interfaces | Large |
We now have all of the raw data we need to produce our estimate.
By the way, through our daily stand-ups, we have surfaced that we are the type of organization that does not do a good job of considering non-functional requirements while sizing solution pieces. Because of this, we plan to multiply our rough estimate total by ɸ (1.6) in order to compensate for overlooking these efforts earlier.
Moreover, our Software Engineering and Business Analyst practices have noted that previous work we have done on comparable “Medium” sized Workflow and Reporting projects have required 6 weeks of effort.
Now It’s Just Math
We feel that our understanding of the project is fairly rough, so we use a mapping to the Fibonacci value that tends to the lower values; “Extra Small” is a 2, “XL” is a 13.
Our view of the project estimate now looks as follows.
Figure 16. Pulled together to compute result
| Piece | Practice / Specialty | T-shirt Size | Ratio | Estimate |
|---|---|---|---|---|
| Account Management | Business Analyst | Extra small | 2 | |
| Profile | UX | Small | 3 | |
| Rules Engine | Business Analyst | Large | 8 | |
| Machine Learning | ML | XL | 13 | |
| Workflow | Software Engineer | Medium | 5 | 6 weeks |
| Reporting | Business Analyst | Medium | 5 | 6 weeks |
| ETL | Interfaces | Large | 8 |
Using the Fibonacci/weeks ration established through our Workflow and Reporting experience, we can fill out the rest of the table and add in our “non-functional requirements” factor.
Figure 17. Final estimate
| Piece | Practice / Specialty | T-shirt Size | Ratio | Piece Estimate (in weeks) |
|---|---|---|---|---|
| Account Management | Business Analyst | Extra Small | 2 | 2.4 |
| Profile | UX | Small | 3 | 3.6 |
| Rules Engine | Business Analyst | Large | 8 | 9.6 |
| Machine Learning | ML | XL | 13 | 15.6 |
| Workflow | Software Engineer | Medium | 5 | 6 |
| Reporting | Business Analyst | Medium | 5 | 6 |
| ETL | Interfaces | Large | 8 | 9.6 |
| Sum: | 52.8 | |||
| Delivered Estimate [multiply by ϕ (1.6)]: |
85.5 weeks | |||
| These estimates are the starting place for detailed story development if a contract is procured. | ||||
This estimate pulls together all of the information, experience, and wisdom available to the organization providing it.
It is as accurate as possible.
It can serve as the basis for a durable agreement between the requesting stakeholders and the likely providers of the solution.
Time to Make Agreements and Move On to the Project
This process will consistently project the total cost to deliver a solution of any reasonable size. It does not rely on big, upfront design and accommodates continually improving understanding of components. It is transparent regarding its approach to measuring the unknown and provides a framework for sharing just enough context between estimators. It explicitly considers the cost of operational support and has built-in elements to manage project changes as they occur. It is a holistic view across all dimensions of the estimation challenge, including:
- Efficient application of wisdom and expertise
- Enforced decomposition at an estimation useful level
- Pressure to not over design during estimation
- Working from what is known to what is needed
Finally, the artifacts it produces can be directly fed into the next phase of a successful strategy, program increment planning.
Future Considerations
Over time, delivery organizations can expect to accumulate very useful information regarding the estimated and actual effort cost to deliver solutions. Depending on the scale of an organization, given the estimation abstraction used here and the explicit shared understanding of the domain, industry vertical, and practices involved, a utility can emerge to help strengthen the accuracy of estimations for more and more component pieces. In fact, these insights can be inserted into the middle-out estimation process at key integration points, much like a machine learning life cycle [Mll07], where project experience regarding estimate-to-actual performance is used as data to improve results for the next decompositions, t-shirt sizings, applied Fibonacci values, extrapolations, and non-functional requirements considerations.
Since project teams vary regarding their blend of delivery capability with respect to multiple technology practices, enhancing the process by incorporating more project team member information may significantly improve estimation accuracy.
Conclusion
Outlined in detail above, we have demonstrated how to pull together the known successful ingredients in accurate project estimation through the following process:
- Applied the t-shirt sizing abstraction to well architected solution pieces
- Mapped these sizes to the agile point sizing Fibonacci numbers as a basis for rough size but comparable numeric values
- Scaled those values to effort-hour estimates based on previous project experience
- Compensated for frequently overlooked estimation gaps
Through this process, projects of all sizes, domains, and maturity levels can delight stakeholders while empowering providers.
References
| [Gal01] | Nick Gall. Web-Oriented Architecture: Foundation for Web 2.0. Conference Proceedings, 2006. Gartner Application Integration & Web Services Summit. |
| [Vis02] | Visual Paradigm. What Is Story Point in Agile? How to Estimate a User Story. Website, 2019. https://www.visual-paradigm.com/scrum/what-is-story-point-in-agile/. Last visited: 28.12.2019 |
| [Sca03] | Scaled Agile Inc. Scaled Agile Framework – SAFe for Lean Enterprises. Website, 2020. https://www.scaledagileframework.com/. Last visited: 28.12.2019 |
| [Sca04] | Scaled Agile Inc. Strategic Themes. Website, 2020. https://www.scaledagileframework.com/strategic-themes/. Last visited: 03.01.2020 |
| [Inn05] | Innolution. T-Shirt Sizing. Website, 2020. https://innolution.com/resources/glossary/t-shirt-sizing. Last visited: 03.01.2020 |
| [Sca06] | Scaled Agile Inc. PI Planning. Website, 2020. https://www.scaledagileframework.com/pi-planning/. Last visited: 06.01.2020 |
| [Mll07] | Google Cloud. Making the machine: The machine learning lifecycle. Website, 2020. https://cloud.google.com/blog/products/ai-machine-learning/making-the-machine-the-machine-learning-lifecycle. Last visited: 10.01.2020 |
Software Engineering Tech Trends (SETT) is a regular publication featuring emerging trends in software engineering.
